Labor Market and Social Policy: A trap of contracted differentials
Uladzimir Valetka
Summary
The steady increase in the birth rate continued throughout the year 2013; however, the structural difficulties in the labor market that remain in place leave no hope that the human capital will provide an increasing contribution to the economic expansion in the medium term. The contracted differentials result in a drain of qualified personnel, whereas the outflows of labor migrants undermine labor productivity in the economy. At the same time, the policy of targeted wage pushes causes increases in employers’ costs and discourages further job creation. In order to remain competitive, the economy needs a dynamic labor market; however, this is something that the social security system does not allow.
Trends:
- Reductions in the working-age population and ageing of workforce;
- Lower rate of job creation;
- High labor turnover and brain drain;
- Failure of social security institutions to meet the requirements of the labor market;
- Higher birth rates amid instability of marriages.
Demography
In 2013, the natural population decline further shrank to 7,409 people, which is a 30.4% decrease from the 2012 level. At the end of 2013, Belarus’ population was at 9.468 million, up from 9.464 million at the start of the year.
In 2013, 118,463 babies were born in Belarus, and 125,872 people died. The number of deaths went down by 659, or 0.5%, from 2012, while the number of births increased by 2,570, or 2.2% year-on-year. Overall, the number of deaths was 6.3% above the number of births in 2013, which compares to 9.2% in 2012).1 Just as in previous years, the population decreased in all Belarusian regions, whereas the population of Minsk increased by 16,000 people. During the last five years, the population of the capital city increased by 90,000 people.2 However, the trend towards a decline in the working-age population is still there – in 2013, a reduction by 64,400 people was recorded, and in 2012, by 86,400 people).3 The gradual reduction in the share of the working-age population is caused by demographic factors (analyzed in detail in previous issues of Belarus Yearbook)4 – as the share of people older than the active working age increases, the share of the working-age population goes down. According to a forecast published by Belstat, by the year 2032, the working age population will have reached 4.874 million, whereas the population beyond the working age will have amounted to 4.361 million, meaning that the share of the working-age population will be at approximately 52.8% (which compares to 59.5% in 2014). The share of the population younger than the working age is expected to grow until the year 2023.5
The Demographic Security Program for 2011–2015 is designed to respond to the challenge of the adverse demographic factors. One of the measures envisaged by the program that was implemented in 2013 and resulted in a substantial increase in spending from the Social Security Fund was a new regulation to peg the child care allowance (for children under three) to the average wage of one parent. Belarus also considers introducing the so-called maternity capital (which was first paid in Russia back in 2007). The ‘Big Family’ program might become a project similar to the maternity capital initiative. A family might receive an approximate USD 10,000 for the first child and USD 20,000 for a second child, according to preliminary estimates.6
In 2013, the number of weddings increased by 14.3% year-on-year, while the number of divorces dropped by 7.5%. The divorce-to-wedding ratio reached 414 to 1,000 in 2013, down from 512 to 1,000 in 2012; however, the institution of marriage remains highly unstable–in the first quarter of 2014, the ratio increased to 587 to 1,000 from 530 to 1,000 in the first three months of 2013. Therefore, the birth and childrearing costs incurred by families are reduced (through the increase in allowances) against the backdrop of the asynchronous trend towards the continuous growth in the birth rate amid the increasing instability of marriages.
In 2013, the migration gain amounted to 11,643 people, thus making up for the natural population decline and therefore increasing the population by 4,200 from January 2013. The migration gain increased from the 2012 level by 2,315 people, or by 24.8%. The number of foreigners who came to stay in Belarus increased by 8%, or by 1,500 people, while the number of Belarusians who left the country fell by 10.5%, or by 1,000 people. Most of the immigrants came to Belarus from the CIS – 75.6% – namely from Russia, Ukraine and Kazakhstan. Most of the Belarusian who left the country in 2013 chose to go to Russia.
However, lots of additional factors should be taken into account when we assess the external migration impact, something that we already discussed in the previous Belarus Yearbook issues. Let us consider two factors now.
First, according to amendments to the relevant Instruction,7 the category of migrants coming to Belarus included minor citizens of Belarus who were born abroad8 (about 3,000 children annually) starting 2012.
Second, it is no secret that the real mutual migration turnover between Belarus and Russia differs a lot from what official statistical reports tell us. For one thing, the data presented by the Belstat and Rosstat services as to the migration turnover are very much different. According to the Belarusian service, 4,953 people left for the Russian Federation in 2011, whereas Rosstat reported that 10,182 Belarusians came to Russia. The gap broadened in 2012, as Belarus officially reported 5,493 emigrants to Russia, while Russia recorded about 16,564 Belarusian immigrants. The difference, at 11,071 people in 2012,9 is commensurate with the annual migration gain reflected by the official Belarusian statistics.
Employment and unemployment
In 2013, the number of the employed reached 4,517,800 people, a decrease by 1.3%, or by 53,300 people, from 2012.10 The share of those employed by privately-own businesses increased to 56.2% from 54% in 2010).11 However, the share of workers employed by state-owned companies increased as well, to 21.7% from 20.3% in 2010.
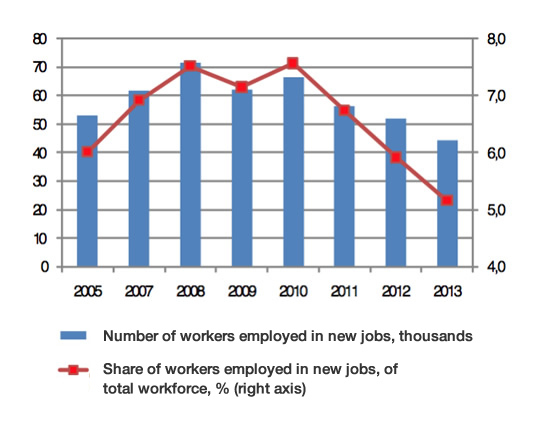
The Economy Ministry set itself a task to create more than 200,000 ‘highly productive jobs’ (about 5% of Belarus’ workforce), including 56,000 new jobs in 2013. It was planned that those new jobs would “additionally generate between 2% and 3% of GDP”.12 However, last year, only 44,500 new jobs were created. The rate of job creation fell (see Figure 1), meaning that the modernization process slows (based on the indicators reported in 2013, more than 50 years will be required to completely renew jobs in the country).
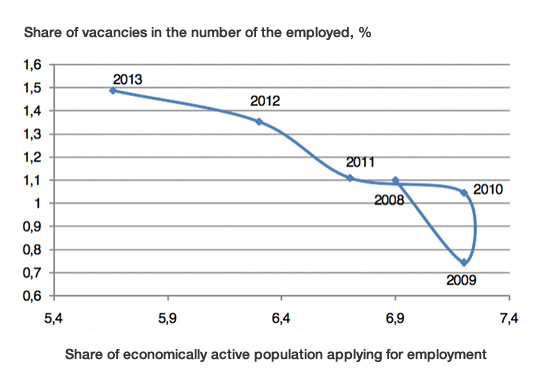
It takes too long to reallocate workforce towards new jobs in sectors with a higher productivity,13 while labor turnover remains very high (the labor turnover ratio reached 55% in 2013). Workforce flows are motivated by a rent-seeking disposition (search for less challenging jobs, especially in the public sector, with hardly any pay differences), rather than the wish to effectively work in a new job. This labor turnover can be partially attributed to seasonal trends, especially in the public sector. On the other hand, emigrants traditionally make the most active and highly productive portion of the workforce. Labor migration affects supply in the internal labor market, which is evidenced by the fact that the number of applications to job centers for employment decreased faster than the number of vacancies grew14 (see Figure 2). In 2013, 257,000 people applied to job centers for assistance in employment, down 11.5% year-on-year, of them 158,300 people were registered as officially unemployed, down 11.9%. Overall, 182,100 people found new jobs via job centers in 2013, including 121,000 people with an unemployed status.
The officially registered unemployment level remains quite low.15 As of late 2013, there were only 20,900 officially unemployed Belarusians in the country, or 0.5% of the economically active population. In 2013, the average time it took an unemployed person to find a job reached 1.4 months. It took women longer than men to find a job (1.8 months against 1.2 months), while young people took an average 1.3 months. As of 1 January 2014, men accounted for 59.4% of the unemployed, and young people aged between 16 and 30 accounted for 34.6%. Unemployed Belarusians with university degrees accounted for 10% of the total.
At the same time, 17.2% of the unemployed are those ‘requiring special social protection’ – the category that covers those who are unable to effectively compete in the labor market, including incapacitated people, parents in large and single-parent families and those with disabled children, former convicts, veterans of foreign combat operations, young people aged under 21 who seek their first employment, etc.16 However, because of the low unemployment allowance, job centers cannot be regarded as institutions that offers high-quality workforce and facilitates economic restructuring.
Labor migration and wages
In a situation where the Belarusian labor market institutions are unable to effectively reallocate workforce, the inflow of workers from foreign countries keeps growing. In 2013, more than 18,000 foreigners came to work in Belarus, at least twice as many as in 2012. “The main reason is the expansion in the investment projects implemented in Belarus, specifically, those associated with the construction of the nuclear power plant and facilities to be used at the 2014 IIHF World Championship in Minsk,” a spokesman for the Interior Ministry said. Most of the foreign workers who have come to work in Belarus are from Ukraine (7,000), China (3,000), Turkey (1,300), Lithuania (1,200) and Uzbekistan (1,200). Also in 2013, 5,500 labor migrants left Belarus to work in foreign countries (based on official job contracts), down by 15% year-on-year.
At the same time, experts note that unregistered migration flows substantially exceed those officially registered. In 2013, the number of Belarusian labor migrants working in Russia at any given time was estimated at 130,000–150,000 people.17 Given the relatively short foreign employment period (less than six months even under officially registered labor contracts), this figure means that the number of Belarusian labor migrants working in Russia was between 300,000 and 600,000 people throughout the year (most experts seem to agree with this estimate).
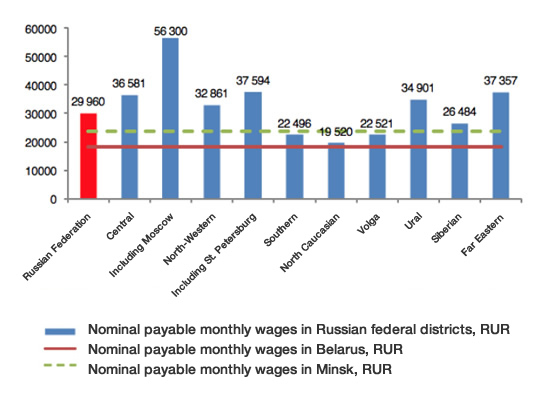
The absence of obstacles to labor migration within the Common Economic Space (CES) aggravated the structural problems of the Belarusian labor market, where in 2013, the average wage was at least 40% below that paid in Russia. This gap encourages Belarusian workers to seek jobs in Russia. According to the Russian Federal Migration Service (FMS), out of the total number of Belarusians registered at their temporary residence (713,000 as of 1 January 2013), the two Russian Federation constituents with the largest urban areas and wages well above the Russian average – the Central and North-Western districts – accounted for almost 80% of Belarusian labor migrants, with 42% and 35.7% of the total, respectively (see Figure 3).
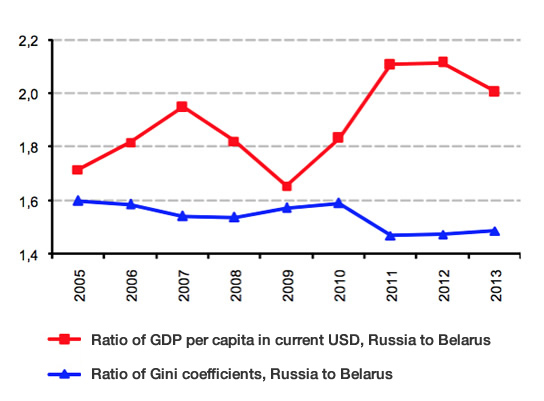
However, even more important is the fact that Belarus is currently faced with contracted compensation differentials, which is a reason why the gap between the incomes of skilled and unskilled workers is insignificant. This results in a situation when more productive workers are ousted from jobs. The Gini coefficient can help assess the return on investment in qualification – in Russia, it is approximately 50% higher than in Belarus, see Figure 4.
Belarus therefore found itself in a trap of equal incomes: all efforts to push wages with a view to keeping skilled personnel fail, because the ousting factor – the relatively low return on human capital – remains strong. Positive migrant selection results in a lower labor productivity and slower GDP growth because of brain drain.
This trap is also reflected in the way jobholders respond to increases in wages: the efforts by the economic authorities are not reciprocated by adequate increases in productivity (see Figure 5). As a result, the share of wages in GDP keeps growing (see Figure 6), meaning that unit labor costs increase (they are currently higher in Belarus than elsewhere in the CES). The same applies to the labor tax (partial transfers of wages to the Social Security Fund).
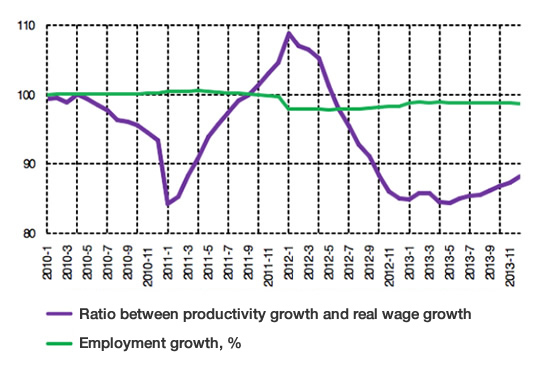
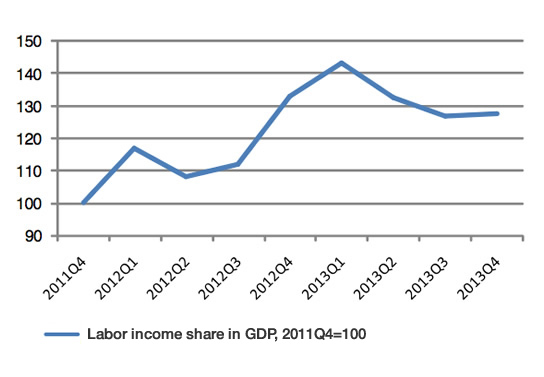
A country cannot continuously boost wages without ensuring a corresponding increase in productivity. The Belarusian economy will have to eventually opt for ‘internal devaluation’ amid the slowdown in growth caused, among other factors, by further narrowing in external markets (especially the Russian market). Some features of ‘internal devaluation’ became apparent in the second half of 2013, when the growth in wages became twice as slow as in 2012 (see Figure 6), and the number of workers dismissed due to downsizing started to grow. However, the pressure on the exchange rate of the national currency remains in place, and so does the expectation of nominal devaluation. Against the poor macroeconomic backdrop, the inflation spiral is a major obstacle to foreign direct investments.
Privately-owned businesses complain about the poor quality of the workforce.18 These problems seem to stem from the inadequate quality of education, but educational institutions simply reflect other structural problems, primarily the challenges faced by labor market institutions, which seek to narrow pay differentials instead of encouraging productivity. Currently the minimum wage is higher than the tariff wage rate of a college professor. When it comes to the difference between the compensation categories in the wage scale effective in the public sector, the top wage rate is currently only twice as high as the lowest wage rate, whereas previously the highest pay rate was eight time higher than the bottom rate (efforts to equalize rates were made when consumer inflation peaked in 2011, and adjusting indices were introduced). Therefore, a reform is necessary in order to effectively regulate the system of labor compensation. Specifically, the Unified Wage Tariff System needs to be cancelled, and industry-specific compensation schemes need to be put in place.
The increase in underemployment also suggests that the economy and the labor market have accumulated a heavy burden of problems.19 According to the Belstat statistics service, in January-December 2013, forced unemployment amounted to 127,100 people, or 3.8% of the number of listed employees (which compares to 92,700 people, or 2.7% of the number of employees, in 2012).
The number of employees transferred to a part-time working week (during daytime) amounted to 49,600 people in 2013, or 182.1% of the level reported in January-December 2012 (27,300 people). The number of workers who were forced to go on vacations at the initiative of the employer amounted to 77,400 people, or 118.4% of the 2012 level (65,400 people).
Administrative regulation measures were actively used to manage underemployment processes. Some enterprises got their employees to leave on ‘social’ rather than forced vacations, which resulted in lower underemployment figures.
Social programs
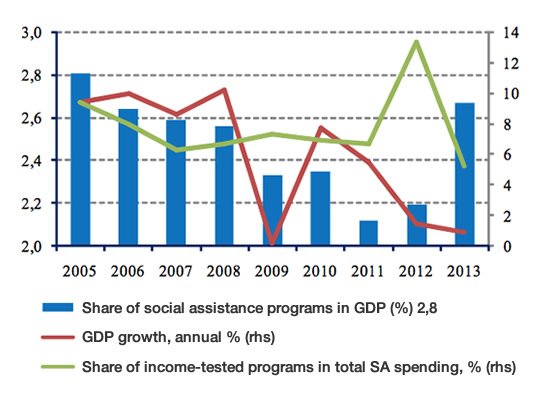
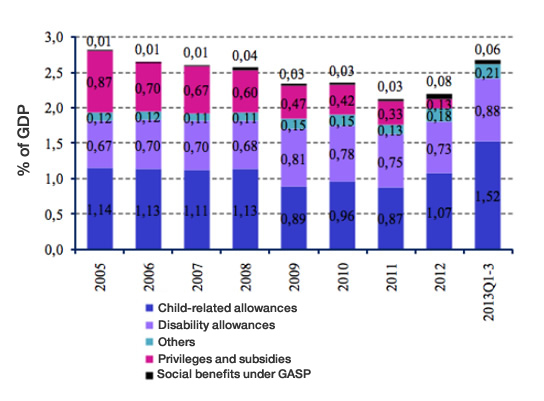
Formally, the year 2013 showed that the financing of social assistance programs (social security is not included here) has a counter-cyclical nature: as GDP contracts, social assistance increases–to 2.2% of GDP from 2.5% (see Figure 7). Social assistance was mostly focused on families with children, which resulted in a reduction in the share of spending on social assistance that requires probing into the level of incomes to 5% of the total from 13%. Because the child care allowance provided to families with children younger than three years of age was pegged to the average wage, the share of allowances associated with children reached 63% of all expenditures on social programs (see Figure 8).
As a result, the expenditures of the Social Security Fund on child care allowances (available to families with children under three) increased dramatically, whereas the growth in pensions halted in the second half of 2013 (as of late December 2013, pensions increased by only 0.5% year-on-year in real terms). Despite the increasing pension pressure on the workforce (in 2013, the workers-to-pensioners ratio fell to 1.69 from 1.73 in 2012), there were no initiatives to reform the pension system.20 It appears that both parametric (increase in the pension age) and structural (introduction of a contribution pension system) improvements are called for. Unemployment benefits – amounting to not more than two basic units (BYR 260,000 as of 1 October 2013) – are also paid from the Social Security Fund. As of today, the average unemployment benefit amounts to BYR 142,600, or 13.9% of the minimum subsistence budget, 9.7% of the minimum wage, and 2.6% of the average wage.
The unemployed are also entitled to apply for state targeted social assistance (GASP), enabling them to maintain their household’s income at least at the level of the minimum subsistence budget per family member (the poverty line in Belarus) during six months per years. In 2013, fewer than 1,000 jobless Belarusians received this type of assistance.21
The existing unemployment insurance system allows workers who have been dismissed on the grounds of redundancy to maintain their consumption level for three months (they receive redundancy payment totaling three average wages). Overall, the unemployment benefit and allowances (including, but not limited to state targeted social assistance) do not guarantee that there will be no months when an unemployed person will have an income below the minimum subsistence budget, which may become a major obstacle to mobility and active job search. This is what sets Belarus apart from developed countries, which are well aware that job search is the most productive activity in society. In 2012, Belarus spent only 0.004% of GDP on unemployment benefits, which compared to 0.39% in transition economies and 0.61% in the OECD.22
It is safe to say that the social security institutions of Belarus fail to meet the requirements of a dynamic labor market. The existing initiatives are hardly implemented. In 2013, the Ministry of Labor and Social Security, in association with the UNDP, developed approaches to a socially-responsible policy of restructuring enterprises. Nevertheless, instead of focusing on the support for requisite labor market reforms, the government keeps redistributing funds in favor of forming future human resources. In the meantime, the responsibility for resolving labor market problems is passed on to future generations.
Conclusion
The policy of targeted hikes in wages brings about further growth of labor costs and discourages efforts to create new jobs in the future. To remain competitive, the economy should resort to unpopular ‘internal devaluation’ measures.
The existing social security system is not ready for a more dynamic labor market. The unemployment insurance system should be reformed, because workers should be paid to be stimulated to search for a more effective use of their skills, i.e. to be involved in the most productive activity.
The Belarusian economy may have to resort to ‘internal devaluation’ measures if growth continues to slow. The pressure on the exchange rate of the Belarusian ruble remains in place, nominal devaluation is expected, and an inflation spiral has already emerged. The only way to keep the workforce motivated, stimulate productivity and make the labor market more dynamic is to increase pay differentials. At the same time, the requirements to social programs, which are supposed to meticulously channel funds to make up for the real reduction in the consumption level, are getting tougher.